Arkive Big Data Project
API data ingestion, transformation and KPI dashboards, delivered with automated tests and a containerised CI/CD pipeline.
Behind the numbers
The documented route from external data to the dashboard.
External APIs
API-based ingestion brings external data into the application pipeline.
KPI dashboard · Ingest
Behind the dashboards
Explore the engineering decisions and their supporting evidence.
Overview
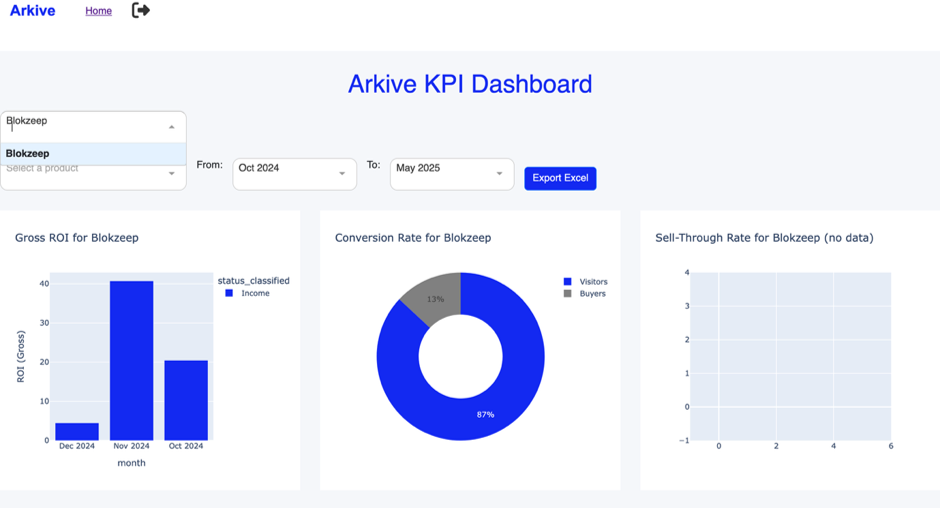
A production-oriented analytics platform built for Arkive during the Big Data minor at the Hogeschool van Amsterdam: ingesting data from external APIs, transforming it, and presenting it as KPI dashboards.
Context & pipeline: Overview. 1 of 6.
What I learned
Moved from building standalone analyses to delivering a maintainable, team-based data application under real-world constraints: data quality, database design, dashboard UX, version-control workflow, testing and cloud-ready deployment.
- Python
- Flask
- Dash
- Plotly
- SQLAlchemy
- MySQL
- APIs
- Pytest
- Docker
- Terraform
- CI/CD